Blog

Making your data smarter: How we designed a new reporting tool for sustainability leaders


Note: This article predates our launch as Worldly.


Across data science, customer success, product and development, we put our heads together to better facilitate how customers use Higg data for reporting tools


Written by: Sam Vijghen, Information Architect


I take great pride in designing products that cater to customer needs. It’s my job to step inside their minds – spending time to understand who they are and how they think, and designing from the inside out. The right reporting tools are essential.


We first launched Analytics as a dashboard to help businesses understand the full picture of their facility performance, so they can track progress and act on their data. We released the first iteration of Analytics in spring of 2020, and several leading home goods and apparel brands joined as early adopters.


But this was just the first version. We consistently heard that Analytics didn’t provide enough context for businesses to put their sustainability data into action. In fact, Analytics accounted for 26% of all feedback collected and tracked by our customer success team. This is considerable, given the number of tools Higg supports across our platform. Analytics needed to tell a better story, but rather than designing an update based on a hunch, my team needed direction straight from our customers.


To make this overhaul possible, I joined forces with colleagues Niklas Lollo, our Principal Data Scientist, and Jamie Boos, our Director of Customer Success.


To identify opportunities for improvement, we focused less on our products and services, and more on overall user needs. We spoke to customers with an open mind. No script, free from attachment to a specific outcome. We approached the meetings as listening sessions: What does their day-to-day look like? How do they use the data? What types of decisions do they need to make? What are their workflows?


Higg is fortunate to work with organizations who were incredibly generous with their time and willing to sit down with us to share their experiences. After interviewing 6 companies over 10 hours, we came away inspired by the passion and commitment from the sustainability pioneers of the apparel industry.


We discovered that customers needed to:


  • Demonstrate the value of their sustainability programs to stakeholders
  • Quickly address the most critical issues in their value chain, by being able to prioritize issues based on severity and prevalence:
    • Identify compliance violations at individual facilities
    • Identify common pitfalls per impact area for products or supplier segments
  • Identify areas of opportunity for investing in capability building and training


With fresh client conversations in mind, armed with insights and empathy, our interviewer team was able to represent customer needs throughout the entire development cycle. And importantly, we went back to our teams and built a refreshed understanding of our customers across the organization.


Above all, we heard that Analytics should support decision-making and enable customers to take action. So we refocused the tool to give users the lay of the land (performance), tell the heart of the story as well as the struggle (impact), and finally, the action (risks + opportunities). In essence, the update brings together modules from across a customers’ value chain, compiling results into simple, easy to digest charts and graphs, better supporting decision making, reporting, and honing areas for growth.


PERFORMANCE REPORTING TOOLS


Compare segments, identify hotspots, make decisions


Customers can now compare their facilities’ performance across segments such as energy, water and air, and get cued if facility scores are improving or declining. As much as Analytics focuses on honing ways to improve, the sustainability journey happens step by step. We wanted to acknowledge that and show businesses how far they’ve come. These charts make it possible to not only assess performance year over year, but also quickly pinpoint hotspots and inform where to allocate resources.


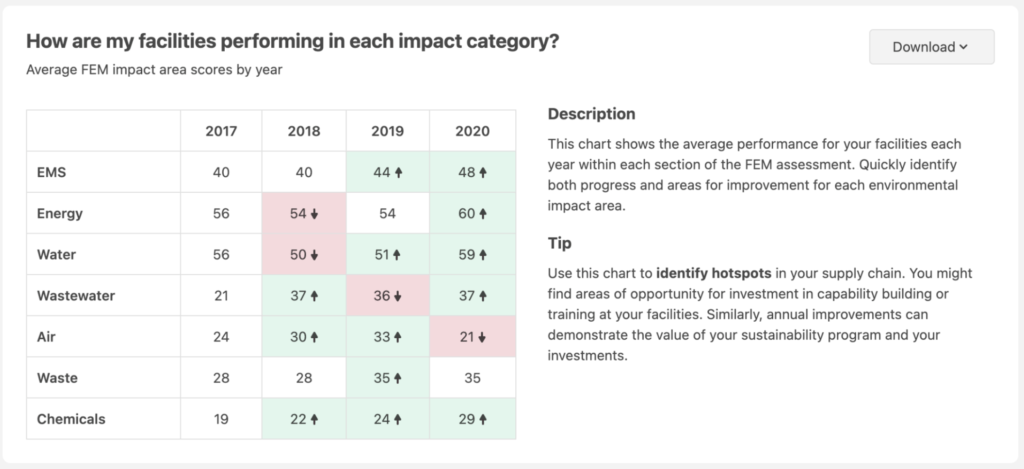
This is an example of a business’s snapshot view of their facilities’ performance, indicating potential areas for improvement.

Performance data can uncover facilities operating without a chemical license, using the most water, or emitting the most carbon, for example. With these insights, organizations can confidently invest resources in training facilities and actively reduce impact.


IMPACT


Tell the story, streamline reporting tools


From sharing sustainability results with internal stakeholders to investors and consumers, articulating sustainability progress is central to our customers’ roles. Analytics now makes sustainability reporting easier with tools that help customers understand their impact, and demonstrate the value of their sustainability programs.


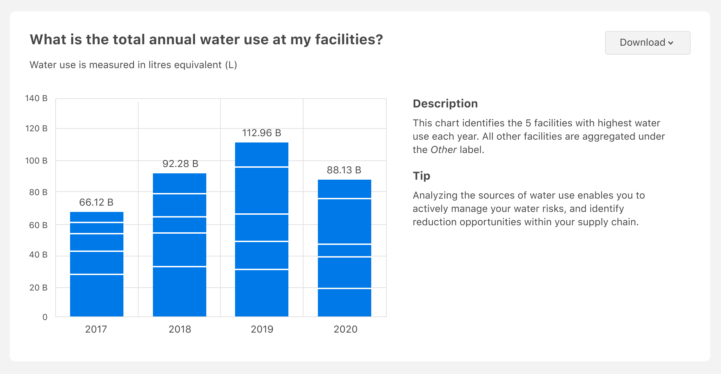
Shown left is a customer’s water use across their supply chain. This snapshot identifies their top five facilities using the most water from 2017 to 2020.

The areas to improve upon should be clear. And when progress happens, such as a 24 billion litre reduction in water from 2019-2020, users should have an unobstructed view of that reduced impact.


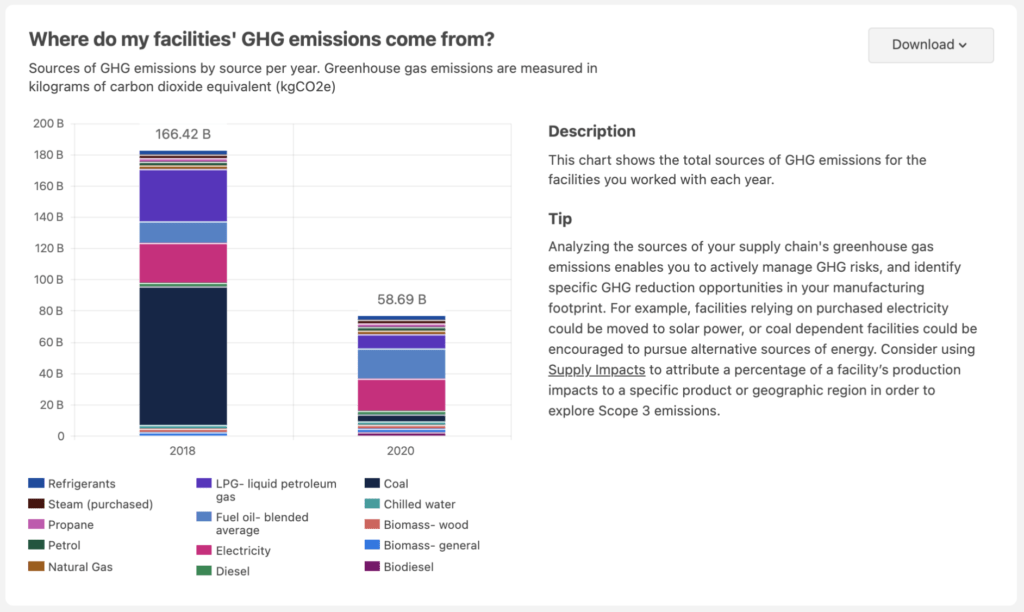
Impact data also helps businesses understand greenhouse gas emissions across their facilities. In this instance, a significant portion of this facilities’ GHG emissions come from electricity. Organizations could use this new understanding as an entry point to reduce conventional electricity sources and integrate renewable sources like solar or wind.


RISKS + OPPORTUNITIES


Identify critical areas, see progress year over year


Finally, we developed a summarized look into critical areas across a customer’s facilities. We blended a year over year analysis with key risk areas, and indicated areas that call for a closer look.  Not only can organizations view the story of their sustainability programs year over year, but they can also identify risks and opportunities across their facilities.


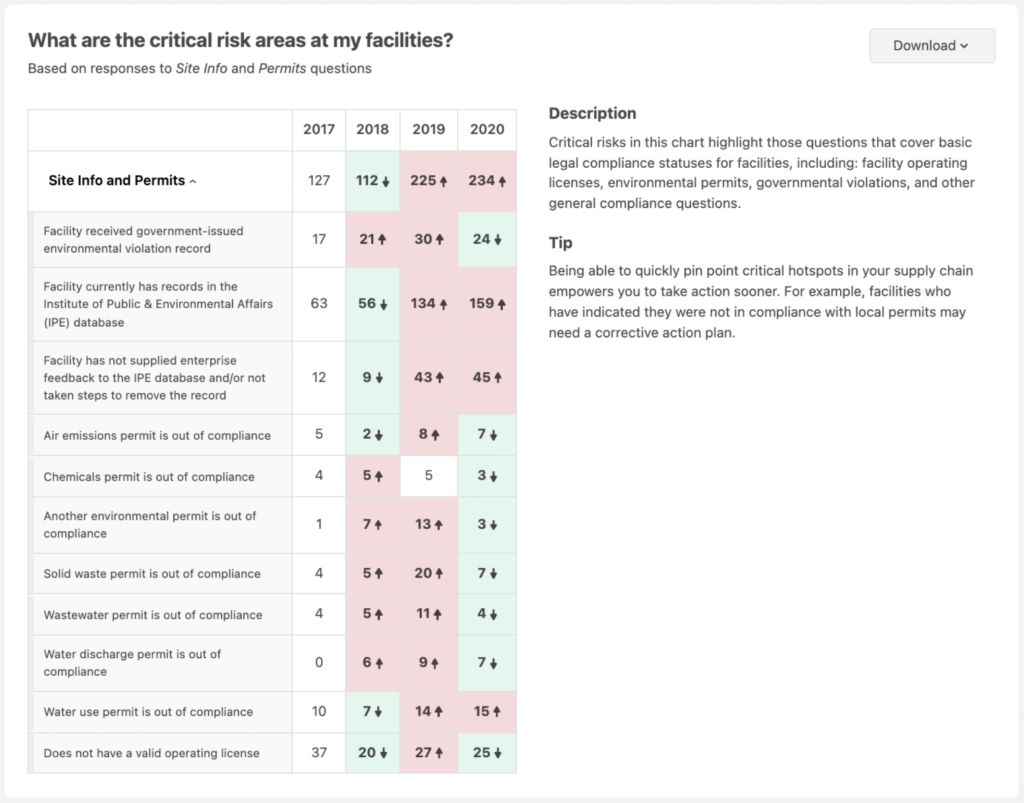
In this example, a company is prompted to dig into responses facility managers provided around permits and compliance that may pose a risk.

We’ve spent over a decade helping our customers gather data. Now, we’re helping customers use that data to better understand their performance over time and tell an accurate story along the way. Analytics opens the door for today’s business leaders to embrace the data available and meet the ever-increasing expectations of sustainability. These reporting tools are a crucial part of the next iteration of Higg.


To learn more about Analytics, check out our product demo. If you’re a Worldly customer interested in sharing your experience with Analytics or participating in future customer research, please reach out to sales@worldly.com.


© 2024 Worldly. All Rights Reserved