
Articles
Analytics: How customer feedback continues to shape our platform


Articles
Note: This article predates our launch as Worldly.
Managing sustainability impact across your supply chain is complicated. Your business has to collect streamlined data from dozens (sometimes hundreds or thousands) of suppliers, analyze the information, and identify where to make changes. With over 45,000 users, we know how complex the data analysis part can be. That’s why we created an impact analysis tool – Analytics – to provide businesses with accessible data visualizations that identify trends across their suppliers and find areas for improvement. Analytics not only helps businesses collect information, it also brings insights to light and makes them actionable, so teams can improve efficiency with reporting data, and accelerate their impact. And we couldn’t have built this tool without our customers informing us along the way.
Higg added Analytics in 2020 to help brands analyze their sustainability data, and since then, our Product and Customer Success teams have been working with customers to help make it more helpful over the years. Since our prior update, we’ve enhanced the functionalities in the tool in response to extensive customer interviews, creating new charts that help businesses report progress and see their progress more clearly. Recently, we’ve added several new features to help make impact management easier than ever.
Our team learned that while Analytics was valuable, brands and retailers wanted a simpler way to understand their impact, and insights to help them meet their sustainability goals. The tool already helps businesses track overall performance in areas including water and carbon emissions. Now, through three new charts, users will also be able to track their total energy consumption, total waste consumption, and see how facilities are performing in impact areas like air, energy, and water.
Higg Customer Success Associate Anna Benzin works with dozens of leading brands and retailers who helped shape the latest charts. For example, a global homeware retailer that requires their suppliers to meet certain sustainability thresholds weighed in. “They asked for a way to visualize whether their suppliers were improving or not, and if they were meeting the retailer’s requirements,” she explains. For a large grocery retailer, this visualization will help support conversations with leadership about overall supplier performance.
The levels of achievement chart now provides a year over year roundup of how many facilities are meeting certain levels of performance in impact areas such as air, energy, and water.
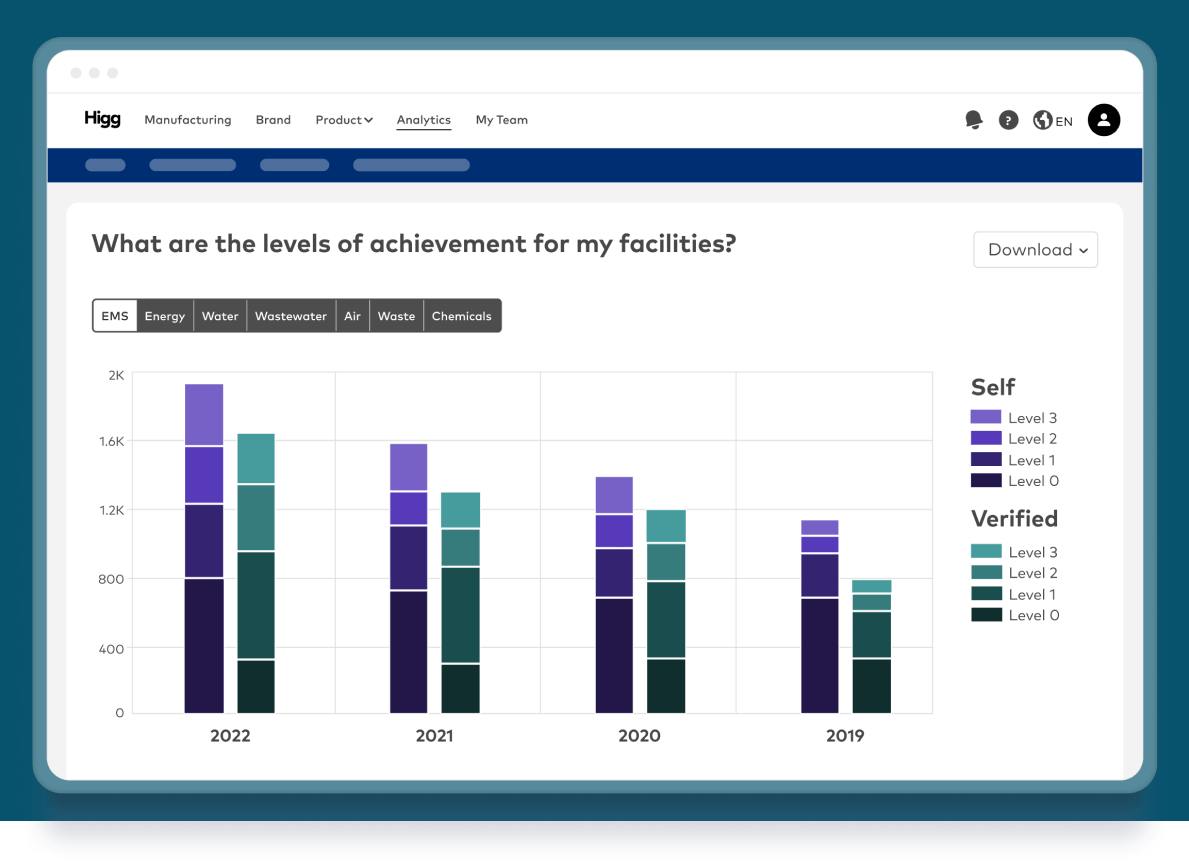
“Across all customer feedback, this was by far the most requested chart. We’re excited to offer users a view of their facilities’ year-over-year impact that helps measure progress and identifies areas to improve,” explains Benzin.
Businesses with carbon targets frequently voiced to Benzin a need to better track energy use. One example includes an international clothing retailer that “specifically wanted to see the breakdown of energy consumption across their suppliers. This would help them better report on their use of renewable energy sources compared to non-renewables.”
“We try to implement our customers’ feedback into product updates as often as we can. Being able to better understand energy consumption was something we heard from customers across the team, and this new chart will make it easier for customers to track progress and work towards emissions goals,” she explains.
Users were also interested in being able to better visualize their suppliers’ waste. With this new chart, businesses can not only see where their waste comes from, but also determine whether or not they should prioritize hazardous waste reduction programs.
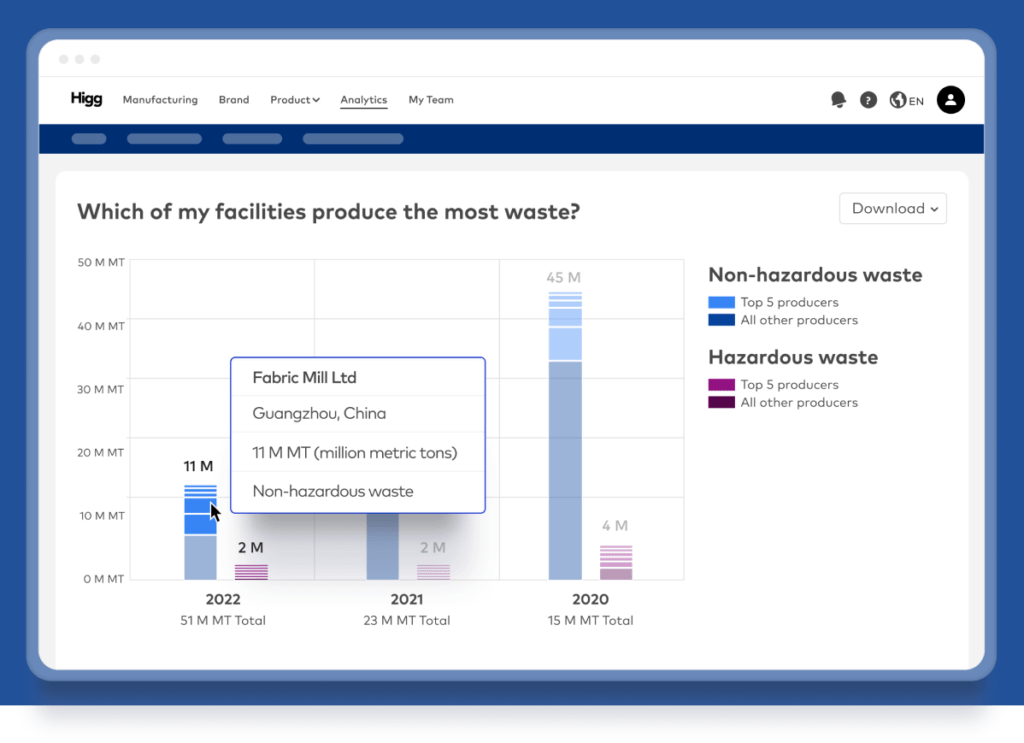
Out of the many clients who voiced this need, one example was a European apparel group who explained the feature as a way to support their annual sustainability reporting. “They wanted Analytics to provide insights on waste at the same level of granularity that it did for water and greenhouse gas emissions. We know this update will significantly help this brand’s reporting, as it will for all other users.
Higg is excited to continue working with users, hearing their needs and building tools that make it easier to improve impact. This latest update to Analytics is just one example of how our team is committed to supporting businesses with actionable insights that help us make sustainability progress as an industry. To start using Analytics for your business, reach out to our team today.


© 2026 Worldly. All Rights Reserved