
Guides
What Your Supply Chain Data Isn’t Telling You About Risk


Guides

A guide for consumer goods leaders to uncover hidden supply chain risks, protect margins, and make confident decisions before disruption hits.
The visibility gap: Supply chain risk you can’t see is what hurts you
The question: building visibility on your terms or someone else’s
A structural problem, not lack of commitment
The shift: from compliance reporting to operational intelligence
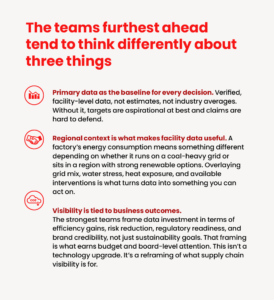
The teams furthest ahead think differently about three things
The framework: Measure, analyze, act — the foundation of supply chain risk management
Where the work gets done: five areas of highest leverage in supply chain risk mitigation
What success looks like: building a supply chain risk management capability

of Cambodian factories exceed dangerous heat thresholds during peak production.

of factories in key sourcing regions face growing water stress.

in apparel earnings is at risk by 2030 from extreme heat and flooding.
Most brands have visibility into costs and logistics — but not into the physical risks and supply chain compliance exposures building across their supply chain. Worldly helps you uncover what’s happening at the facility level, so you can act before disruption hits.

Most consumer goods leaders have strong visibility into costs, output, and logistics. But the physical risks building across their supply chain, combined with rising supply chain regulatory compliance requirements, remain largely invisible.
The physical conditions inside factories, the resource pressures around them, and the operational risks building across the regions they depend on are still only partially understood.
This is a business intelligence gap, not a sustainability gap, even though sustainability teams often feel it first.
Extreme heat is already reducing factory capacity in Southeast Asia during peak production months. Water stress is tightening across the regions where consumer goods sourcing is most concentrated.
At the same time, environmental regulatory compliance and disclosure requirements are accelerating in the EU, UK, and US — and the questions go far beyond what most brands can answer today.
The companies navigating this well haven’t solved sustainability. They’ve built the data infrastructure to see what’s coming, understand what it means for their business, and act before it turns into a crisis.
Primary data — verified, facility-level data collected consistently across suppliers — is the foundation of that capability. This is the core of effective supply chain risk management.
This guide draws on data from Worldly’s platform, which captures environmental and social performance data across a network of more than 45,000 brands, retailers, manufacturers, and suppliers in consumer goods.
That network matters. The insights here aren’t modeled or estimated. They come from what’s actually happening at the facility level, benchmarked across an industry, and enriched with regional context that turns raw data into intelligence, decisions, and action.
What follows is a practical look at what the data already shows, where the gaps are, and how leading brands are turning supply chain visibility into operational confidence, competitive advantage, and credible sustainability progress.

Consumer goods leaders can track a shipment across six time zones in real-time. They can tell you their cost-per-unit to four decimal places. But ask what’s happening inside a Tier 2 factory in Bangladesh, how much energy it consumes, whether it sits in a water-stressed watershed, how extreme heat is affecting worker output and facility reliability, and the answer is usually silence.
That’s the supply chain risk visibility gap. And it isn’t something the sustainability team can solve on its own. It creates exposure across operations, finance, and reputation at the same time, meaning all of those stakeholders are necessary for addressing it.
Physical risks are accelerating faster than most brands’ awareness of them. Extreme heat, water scarcity, and climate volatility are already disrupting production in the regions where consumer goods sourcing is heaviest: Southeast Asia, South Asia, China, Turkey.
These aren’t future projections. They’re current conditions showing up as capacity failures, supplier cost increases, and fill-rate problems that cascade to the retail shelf.
A heat-related slowdown at a Tier 2 supplier doesn’t announce itself as a climate issue. It looks like a missed delivery window.
Supply chain disclosure requirements are tightening in every major market. The EU’s CSRD, revisions to the UK’s Modern Slavery Act, and evolving US requirements all demand evidence-based supply chain compliance, not baseless assertions.
Brands that can’t demonstrate visibility into their upstream operations face compliance risk, obviously. But the bigger exposure is reputational: a public credibility failure when an investor, a journalist, or a regulator asks a question the brand can’t answer.
Scope 3 emissions, those generated in the supply chain outside a company’s direct operations, typically represent 70–90 percent of a brand’s total carbon footprint. Yet without primary supply chain data from Tier 1 manufacturers (and beyond) brands and retailers can’t accurately measure their baseline emissions or any improvements their suppliers make.
For brands that have made public commitments, this creates real exposure: targets that can’t be substantiated, progress that can’t be demonstrated, claims that are open to challenge.
For brands that haven’t yet made public commitments, it’s an expectation that’s coming. Building the data foundation now costs less and causes less disruption than doing it under pressure later.
The brands in the strongest position today aren’t necessarily the ones with the most ambitious targets. They’re the ones with the best data.
They can explain their supply chain clearly, identify risk through systematic supply chain risk assessment, show evidence of progress, and respond when regulators, investors, or their own board asks hard questions. That’s a different kind of confidence than having a bold goal on your website.
Building that capability starts with primary data, enriched with regional intelligence that turns numbers into decisions.
If the visibility gap matters this much, why haven’t more brands closed it?
It isn’t for lack of intent. The issue is that supply chain transparency has been built as a compliance function, not a strategic capability, and the organizational architecture reflects that.
Most brands have reasonable visibility into their Tier 1 suppliers, the factories they buy from directly. Some have partial visibility into Tier 2. Beyond that, the picture fades quickly. Yet the most significant operational, environmental, and social risks tend to sit in Tier 2, Tier 3, and the raw material base — exactly the places where data has been thinnest.
Sustainability teams run environmental compliance audits and assessments. Procurement manages audits. Operations tracks output. These streams rarely connect into a picture that any single leader can act on. Everyone has a partial view. Nobody has the full one.
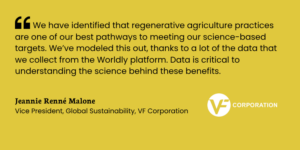
As Cerian Atwell, Sustainability Lead at Marks & Spencer, puts it, the real impact, and the real work, starts deeper in the supply chain.
Knowing the number of kilowatt-hours of energy a factory uses only helps if you also know the grid mix it runs on, how stressed the local watershed is, and what climate risks are bearing down on the region.
Without that layer of regional intelligence, good data still produces generic recommendations instead of targeted decisions. That context layer is what most brands are still missing, and it’s what separates reactive supply chain risk management from proactive supply chain strategy.

The brands making the most progress share something in common: They’ve stopped treating supply chain data as a reporting obligation and started treating it as a tool for making better supply chain risk management decisions.
Data flows in one direction: from supplier to brand to report. It’s reactive, backward-looking, and built to satisfy external stakeholders. Teams spend more time defending the numbers than doing anything with them.
Data becomes the operating system for supply chain compliance and operational decisions. Sourcing, sustainability, and operations teams can see performance trends across the supplier base, identify which facilities are improving and which are falling behind, and focus capital and effort where it matters. The nature of supplier conversations changes, from “please complete this survey” to “here’s what the data shows, let’s figure out what to do about it.”
Verified, facility-level data, not estimates, not industry averages. Without it, targets are aspirational at best and claims are hard to defend. A comprehensive supply chain compliance system depends on this foundation.
A factory’s energy consumption means something different depending on whether it runs on a coal-heavy grid or sits in a region with strong renewable options. Overlaying grid mix, water stress, heat exposure, and available interventions is what turns data into something you can act on for effective supply chain regulatory compliance and risk reduction.
The strongest teams frame data investment in terms of efficiency gains, supply chain risk reduction, regulatory readiness, and brand credibility, not just sustainability goals. That framing is what earns budget and board-level attention. This isn’t a technology upgrade. It’s a reframing of what supply chain visibility is for.
The brands in the strongest position didn’t get there by claiming perfection. They got there by measuring consistently, acting on what they found, and building a track record that holds up when someone checks. A lot of consumer goods brands are already on this path. Primary data makes that progress visible, repeatable, and defensible.
The path from supply chain opacity to operational clarity follows a consistent pattern across the brands doing supply chain risk management well. It isn’t a one-time project. It’s a capability that compounds with each cycle.
Visibility starts at the facility level. This means going beyond survey responses and audit snapshots to collect verified primary data: energy consumption, water use, emissions, and social performance metrics, gathered consistently across a supplier base.
The initial goal is coverage and comparability. Enough facilities reporting enough of the same metrics that meaningful patterns start to emerge.
Worldly captures this across tens of thousands of facilities—allowing brands to benchmark not just internally, but across the industry. That cross-network view is what turns scattered data into something strategically useful.
Facility data tells you what’s happening inside the fence. Regional intelligence tells you what’s happening around it, and what’s likely to happen next. A rigorous supply chain risk assessment combines both.
This means overlaying facility performance with:
The difference is meaningful: It’s the gap between knowing a factory’s energy consumption and knowing what to actually do about it given the specific conditions of the region it operates in. This is the difference between basic environmental compliance tracking and strategic supply chain risk management.
Worldly Axion brings this together, combining verified facility-level data with regional intelligence to surface insights that facility data alone can’t provide.
Data that doesn’t lead to action is just overhead. This stage turns insight into investment by identifying the highest-impact supply chain risk interventions for each facility or supplier segment.
This requires sequencing. Not every supplier should be a priority at once. And it requires a clear picture of what success looks like for each focus area.
The brands moving fastest here are the ones who did Stages 1 and 2 most thoroughly, because their decisions are grounded in evidence rather than assumptions.

Extreme heat is one of the most underestimated operational risks in global supply chains. It rarely shows up on a traditional supply chain risk management dashboard until it’s already caused damage.
Better Work assessments found that 82 percent of Cambodian factories exceed high heat stress thresholds during peak production months, which also happen to be peak shipping months. The losses cascade: a capacity problem at a Tier 2 supplier becomes a fill-rate problem for a retailer several steps removed.
The communities surrounding these factories bear the most direct cost, including health risks, lost wages, and economic instability.
The business case for action is clear. McKinsey found that the benefits of heat adaptation outweigh costs by seven to one. Simple interventions like improved ventilation and scheduling adjustments can deliver productivity gains of up to 16 percent.
Companies that haven’t mapped heat exposure across their supply base are carrying supply chain risks they can’t quantify. It stays invisible right up until it causes a disruption they have to explain.
Actions your team can take:
Water stress doesn’t arrive suddenly. It builds through drought, tightening allocations, and rising costs, then reaches a tipping point that catches brands off guard.
Planet Tracker mapped over 100,000 apparel factories against water stress data and found that nearly two-thirds of factories in China, Turkey, Bangladesh, and India carry medium-to-high water stress scores. At the base of the supply chain, the picture is worse: nearly three-quarters of global cotton production takes place in high-stress regions where smallholder farmers compete with industry for dwindling freshwater.
The financial scale is hard to ignore. CDP estimates up to $339 billion in total potential financial impact from supply chain risk related to water stress. And yet Planet Tracker found that water represented just one percent of investor mentions across major apparel brands. When an entire production cluster is affected at once, switching suppliers is not a viable response.
Actions your team can take:

Across tens of thousands of consumer goods facilities using Worldly, nearly 92 percent report tracking energy use. That’s meaningful progress. Most facilities on the platform, working alongside their brand and retailer customers, have taken the first step toward real operational visibility and environmental compliance tracking.
About 72 percent say they know which processes consume the most energy, which turns energy from a vague line item into something specific that teams can manage and improve. Roughly 67 percent have set targets to reduce energy use. And the results are showing: nearly 48 percent of facilities report improving energy consumption compared to their baseline.
Visibility alone doesn’t guarantee improvement. But it’s the precondition. You can’t manage what you can’t see, and you can’t
replicate what you can’t measure.
Actions your team can take:
Where visibility exists, action tends to follow. About 29 percent of facilities on Worldly report reducing Scope 1 and Scope 2 emissions. These aren’t projections. They’re measured outcomes at facilities where the data exists to guide improvement and meet environmental regulatory compliance requirements.
The Scope 3 picture, though, remains largely unmapped. Only 1.6 percent of facilities currently calculate Scope 3 emissions, a serious gap given that Scope 3 typically represents the vast majority of a brand’s total carbon footprint. And fewer than 18 percent of facilities have conducted an energy compliance audit in the past five years, which limits how deep decarbonization planning can go.
For brands with public climate commitments, this gap is an active liability. For those without commitments yet, it’s an expectation that’s building. Either way, the cost of getting the data foundation right goes up the longer it’s deferred.
Actions your team can take:
Facility data is the foundation, but sustaining progress requires pairing it with regional context. The right intervention for a factory in India, where the grid is coal-heavy, looks very different from the right step in a region with strong renewable options. Where electricity access is unstable, a power purchase agreement might deliver more value than trying to optimize grid-based consumption.
This is where the breadth of the Worldly network becomes a real advantage. With verified data from over 45,000 companies, Worldly doesn’t just benchmark individual facilities. It builds an intelligence picture across regions, industries, and supplier tiers that no single brand could assemble alone. This comprehensive approach enables genuine supply chain risk management.
Combining verified facility-level data with regional intelligence — grid mix, available renewable energy credits, climate risk, and more — Worldly Axion surfaces insights that aren’t available anywhere else. Its built-in AI helps teams spot carbon intensity hotspots across their supplier base, identify the highest-impact levers for each facility, and model what different interventions would actually deliver. The goal is straightforward: make sure investment goes where it’ll do the most good.
This is the capability that moves supply chain visibility from a reporting function to a strategic one. Not just seeing what’s happening, but knowing what to do about it, facility by facility, region by region.
When this work is done well, the change shows up in how a team operates before it appears in any report.
Teams with primary data coverage across their supply chain aren’t caught off guard when new supply chain regulatory compliance requirements land. They already have the evidence base. They can answer questions before they’re asked.
When brands share what the data shows, as a shared performance picture rather than a compliance demand, the dynamic shifts. Suppliers see how they compare to peers. They can see where they stand and where investments would move the needle. That builds trust in a way that audit cycles don’t.
Instead of spending most of Q3 compiling supplier responses for an annual disclosure, teams run live dashboards, flag facilities that are slipping, and have focused conversations about specific interventions. The whole function becomes more proactive and enables continuous supply chain compliance management.
Fewer supply disruptions. Less exposure to climate-driven capacity failures. Stronger supplier relationships. A narrative grounded in evidence that holds up under scrutiny. Those are the outcomes that get attention from the rest of the leadership team — and they all come back to the same thing: primary data, regional intelligence, consistent follow-through, and a systematic approach to supply chain risk management.
If you can answer these, you’re ahead:
The brands in the strongest position didn’t get there by claiming perfection. They got there by measuring consistently, acting on what they found, and building a track record that holds up when someone checks. A lot of consumer goods brands are already on this path. Primary data makes that progress visible, repeatable, and defensible.
Worldly builds the primary data foundations that make real supply chain risk management possible, and turns that visibility into measurable progress across energy, emissions, water, heat, and operational resilience.
Supply chain risk management is the practice of identifying, assessing, and mitigating physical, operational, and regulatory risks across your supplier network. It matters because physical risks—heat stress, water scarcity, climate volatility—are disrupting production in key sourcing regions today, not in the future. Brands that can’t see these risks face exposure across operations, finance, and reputation simultaneously.
A comprehensive supply chain risk assessment combines three stages: measure (collect verified primary data on energy, water, and emissions at facility level), analyze (overlay facility performance with grid mix and climate data), and act (identify and prioritize the highest-impact interventions). This requires moving beyond audit snapshots to consistent, comparable data across your supplier base.
Primary data — verified energy consumption, water use, and emissions collected directly from facilities — reveals what’s actually happening, not what suppliers or industry averages suggest. With primary data, you can identify specific decarbonization opportunities, set realistic targets backed by evidence, and demonstrate compliance with regulations like the CSRD. Estimated data leaves compliance claims vulnerable to challenge.
Two critical gaps expose brands to immediate risk: (1) Most brands lack visibility beyond Tier 1 suppliers, missing risks in Tier 2, Tier 3, and raw materials; (2) Few brands pair facility data with regional intelligence, so they can’t identify the right interventions for specific locations.
Visible supply chain risk management reduces operational disruption from climate events, prevents fill-rate problems cascading to retail shelves, strengthens supplier relationships through shared performance data, and builds the evidence base for regulatory readiness. These outcomes earn attention from operations and finance leaders, not just sustainability teams, and directly protect margins and revenue.


© 2026 Worldly. All Rights Reserved

